 Let's say we have a client that can initiate a network request for any URL on the web but the response is opaque and cannot be inspected. What could we learn about the client or the response? As it turns out, armed with a bit of patience and rudimentary statistics, "a lot".
For example, the duration of the fetch is a combination of network time of the request reaching the server, server processing time, and network time of the response. Each and every one of these steps "leaks" information both about the client and the server.
For example, if the total duration is very small (say, <10ms) then we can reasonably intuit that we might be talking to a local cache, which means that the client has previously fetched this resource. Alternatively, if the duration is slightly higher (say, <50ms) then we can reasonably guess that the client is on a low-latency network (e.g. fast 4G or WiFi). We can also append random data to the URL to make it unique and rule out the various HTTP caches along the way. From there, we can try making more requests to the server and observe how the fetch duration changes to infer change in server processing times and/or larger responses being sent to the client.
If we're really crafty, we can also use the properties of the network transport like CWND induced roundtrips in TCP (see TCP Slow Start), and other quirks of local network configuration, as additional signals to infer properties (e.g. size) of the response—see TIME, HEIST attacks. If the response is compressed and also happens to reflect submitted data, then there is also the possibility of using a compression oracle attack (see BREACH) to extract data from the response.
"Networking thermodynamics"
Each and every step in the fetch process—from the client generating the request and putting on the wire, the network hops to the server, the server processing time, response properties, and the network hops back to the client—"leaks" information about the properties of the client, network, server, and the response. This is not a bug; it's a fact of life. Borrowing an explanation from our physicist friends: putting a system to work amounts to extracting energy from it, which we can then measure and interrogate to learn facts about said system.
Eyes glazing over yet? The practical implication is that if the necessary server precautions are missing, the use of the above techniques can reveal private information about you and your relationship to that server - e.g. login status, group affiliation, and more. This requires a bit more explanation…
The dangers of credentialed cross-origin "no-cors" requests
The fact that we can use side-channel information, such as the duration of a fetch, to extract information about the response is not, by itself, all that useful. After all, if I give you a URL you can just use your own HTTP client to fetch it and inspect the bytes on the wire. However, what does make it dangerous is if you can co-opt my client (my browser) to make an authenticated request on my behalf and inspect the (opaque) response that contains my private content. Then, even if you can't access the response directly, you can observe any of the aforementioned properties of the fetch and extract private information about my client and the response. Let's make it concrete…
- I like to visit
kittens.comon which I have an account to pin my favorite images:- The authentication mechanism is a login form with all the necessary precautions (CSRF tokens, etc).
- Once authenticated, the server sets an HTTP cookie scoped to
kittens.comwith a private token that is used to authenticate me on future visits.
- Someone else entices me to visit
shady.comto view more pictures of kittens...- While I'm indulging in kitten pictures on
shady.com, the page issues background requests on my behalf tokittens.comwith the goal of attempting to learn something about my status on said site.
- While I'm indulging in kitten pictures on
How does shady.com make a credentialed request? A simple image element is sufficient:
<img src="https://kittens.com/favorites" alt="Yay authenticated kittens!">

<!-- Image element is not the only mechanism with this behavior, others
     include script, object, video, etc. Also, there is JavaScript... -->

<script>
  var img = new Image();
  img.src = "https://kittens.com/favorites"
</script>
The browser processes the image element, initializes a request for https://kittens.com/favorites, attaches my HTTP cookies associated with kittens.com, and dispatched the request. The target server (kittens.com) sees a valid authentication cookie and dutifully sends back the HTML response containing my favorite kittens. Of course, the image tag will choke on the HTML and will fire an error callback, but that doesn't matter, because even though we can't inspect the response, we can still learn a lot by observing the timing of the authenticated request-response flow.
With the benefit of a few decades of experience under our belt, and if we were rebuilding the web platform from scratch, we probably wouldn't allow such "no-cors" authenticated requests without explicit CORS opt-in from the server, just as we do today for XMLHttpRequest and Fetch API. Alas, that would be a major breaking change, so that's off the table. However, not all is lost either, because kittens.com can deploy additional logic to protect itself, and its users, against such cross-origin attacks.
Declare your cookies as "same-site"
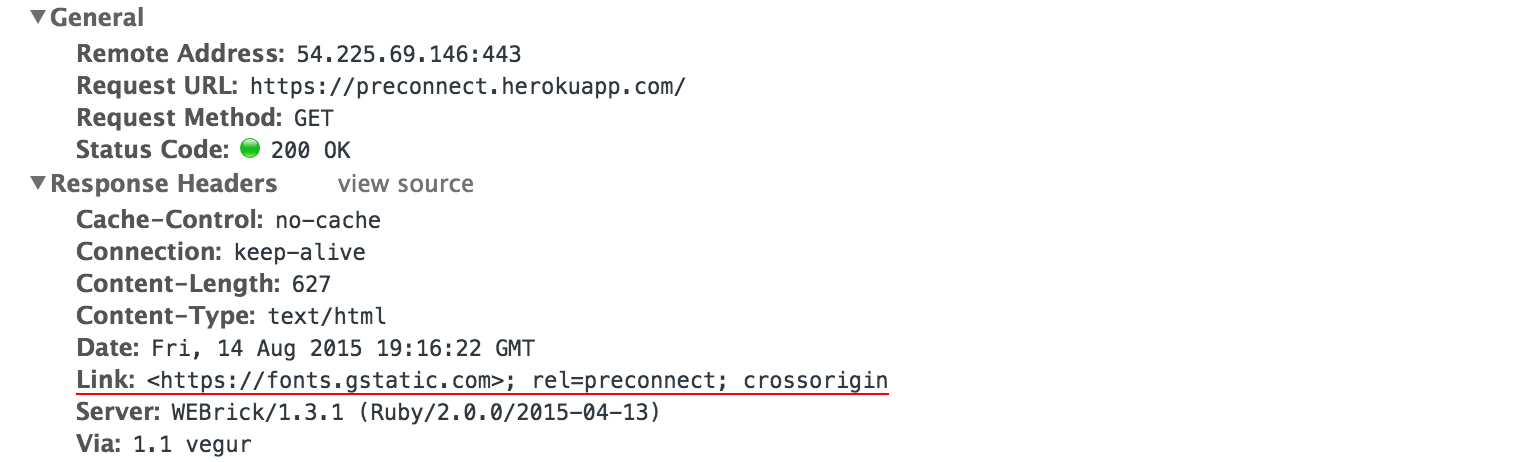
The core issue is that the browser attaches target origin's cookies on "no-cors" requests regardless of the origin that initiates the request. In theory, the target origin could look at the Referrer header, but the attacker could hide the initiating origin—e.g. via no-referrer policy. Similarly, the Origin header is only sent on CORS requests, so that won't help either. However, SameSite cookies give us the exact behavior we want:
Here, we update [RFC6265] with a simple mitigation strategy that allows servers to declare certain cookies as "same-site", meaning they should not be attached to "cross-site" requests…Note that the mechanism outlined here is backwards compatible with the existing cookie syntax. Servers may serve these cookies to all user agents; those that do not support the "SameSite" attribute will simply store a cookie which is attached to all relevant requests, just as they do today.
SameSite cookies have two modes: "strict" and "lax". In strict mode, the cookies are not sent in top-level navigations, which offers strong protection but requires some additional deployment considerations. In lax mode, cookies are sent for top-level navigations-e.g. navigations initiated by <a> elements, window.open(), <link rel=prerender>), which offers reasonable protection. Do read the IETF spec, it provides good guidance.
200 OK HTTP/1.1
...
Set-Cookie: SID=31d4d96e407aad42; SameSite=Strict
Using our example above, if kittens.com set the SameSite flag on its authentication cookie, then the image request initiated by shady.com would not contain the authentication cookie due to mismatch of the initiating origin and the origin that set the cookie and would result in a generic unauthenticated response—e.g. a redirect to a login page. If you're kittens.com, enabling SameSite cookies should be a no-brainer.
More generally, if your site or service does not intentionally provide cross-origin resources (e.g. embeddable widgets, site plugins, etc.), then you should use SameSite cookies as your default.
SameSite cookies are supported in Chrome (since M51) and Opera 39, and are under consideration in Firefox. Let's hope the other browsers will be fast followers. Last but not least, it's worth noting that you also can, as a user, block third party cookies in your browser to protect yourself from this type of cross-origin attack.
]]> You've applied all the best practices, set up audits and tests to detect performance regressions, released the new application to the world, and... lo and behold, the telemetry is showing that despite your best efforts, there are still many users—including those on "fast devices" and 4G networks—that are falling off the fast path: janky animations and scrolling, slow loading pages and API calls, and so on. Frustrating. There must be something wrong with the device, the network, or the browser—right?
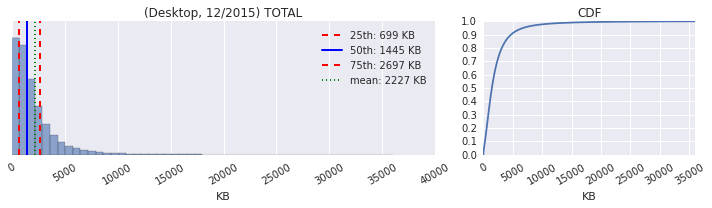
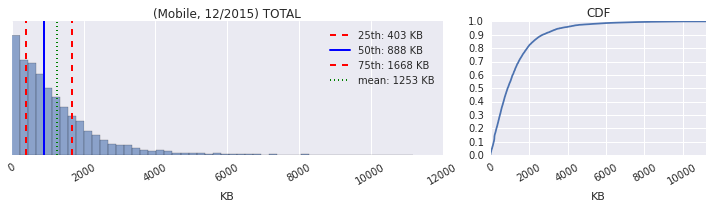
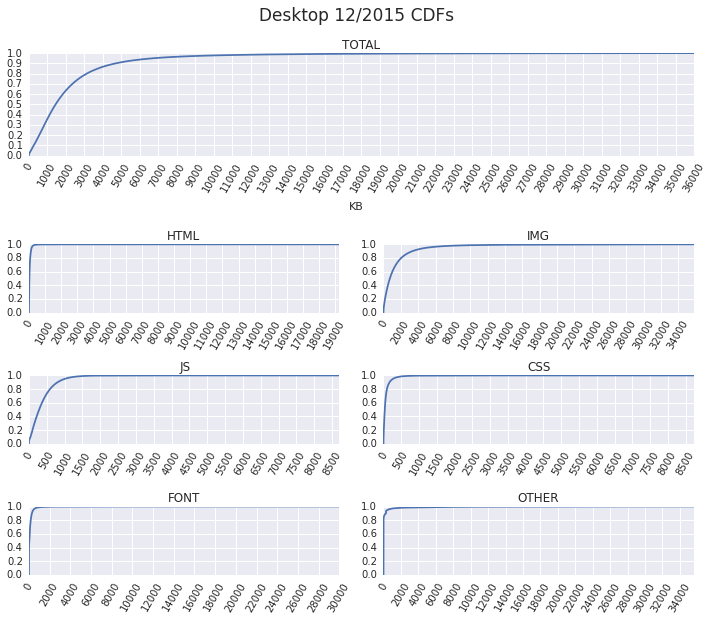
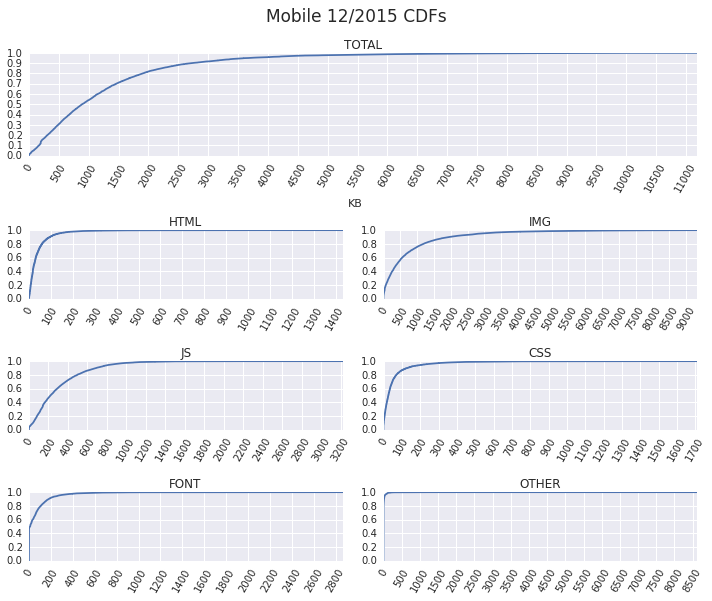
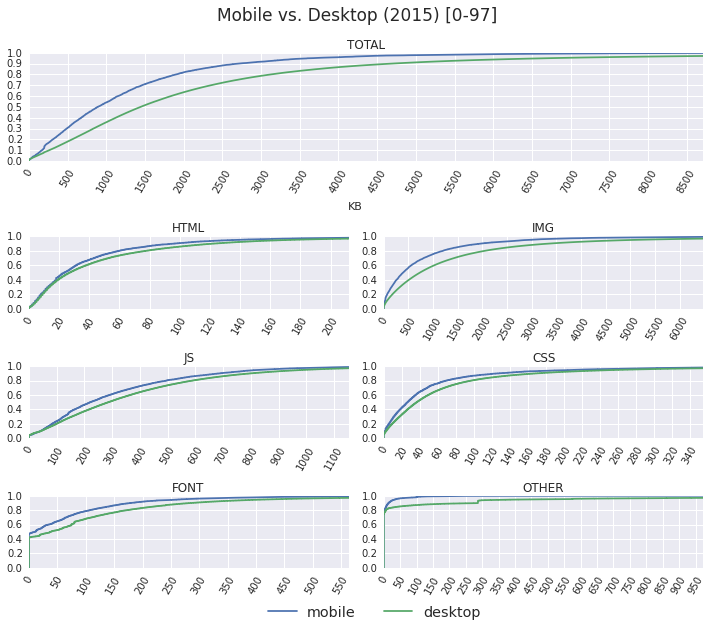
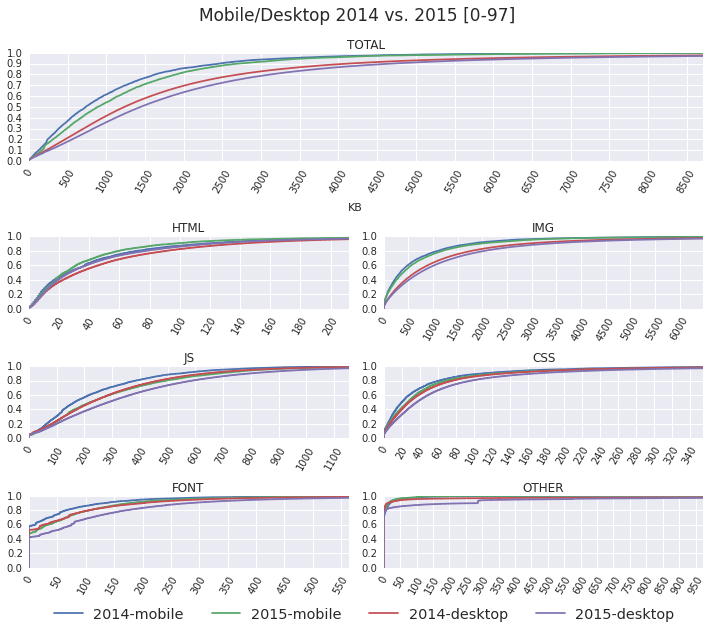
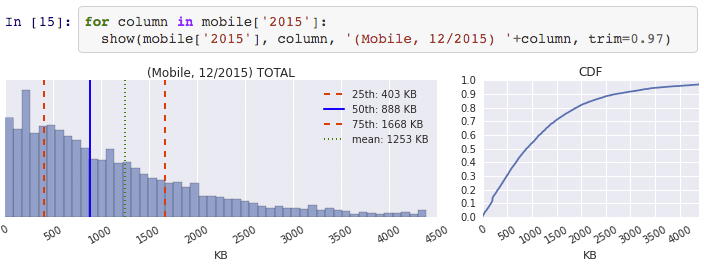
 As anyone and everyone in the web performance community will tell you, the size of the average page is continuously getting bigger: more JavaScript, more image and video bytes, growing use of web fonts, and so on. In fact, as of December 2015, the HTTP Archive shows that the average desktop site weighs in at 2227KB, and mobile is up to 1253KB.
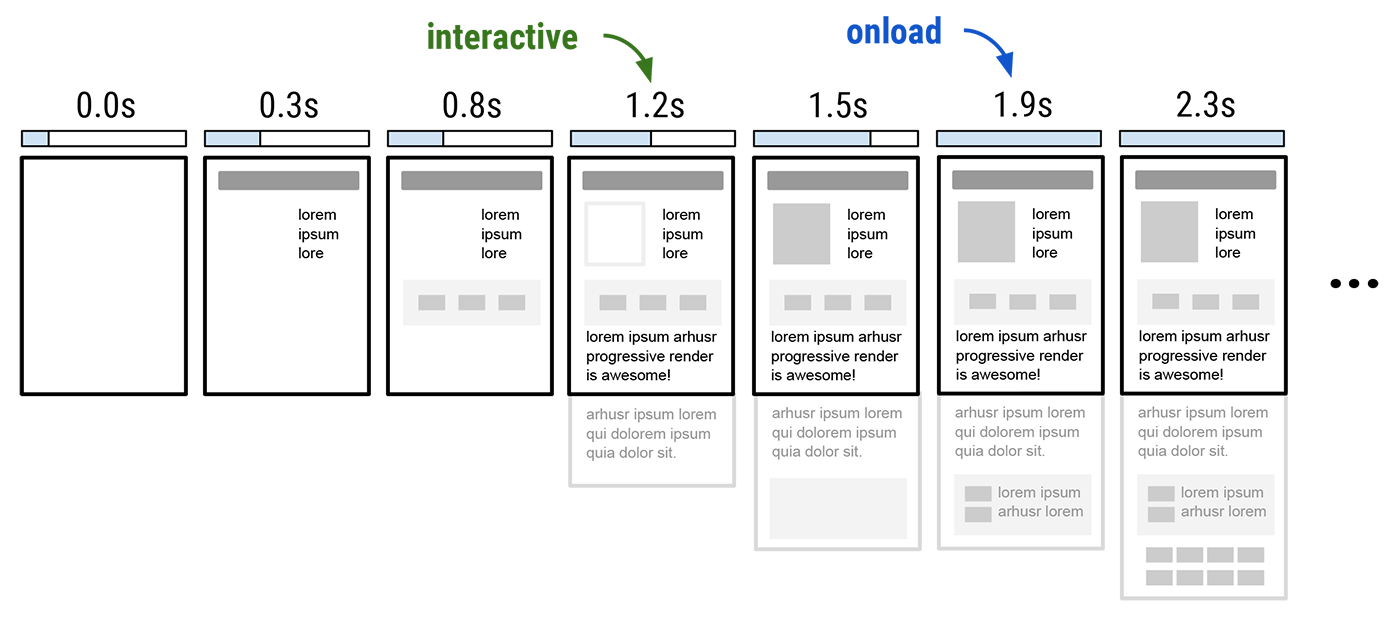
 The user initiates a navigation, and the browser gets busy: it'll likely have to resolve a dozen DNS names, establish an even larger number of connections, and then dispatch one or more requests over each. In turn, for each request, it often does not know the response size (chunked transfers), and even when it does, it is still unable to reliably predict the download time due to variable network weather, server processing times, and so on. Finally, fetching and processing one resource might trigger an entire subtree of new requests.